
My economist colleague John Phelan reported today that Minnesota’s economy has been struggling in terms of growth and jobs between 2014 and 2025. Electricity unaffordability is a key reason for that, not just since 2014, but from 2001 through to 2026, driven by renewables.
Minnesota’s economy has grown at an average annual rate of 1.4%, below 39 out of 50 states. … Minnesota ranked 32nd out of 50 states for employment growth between 2014 and 2025, and 42nd for growth of output per worker. – John Phelan, Poor Productivity
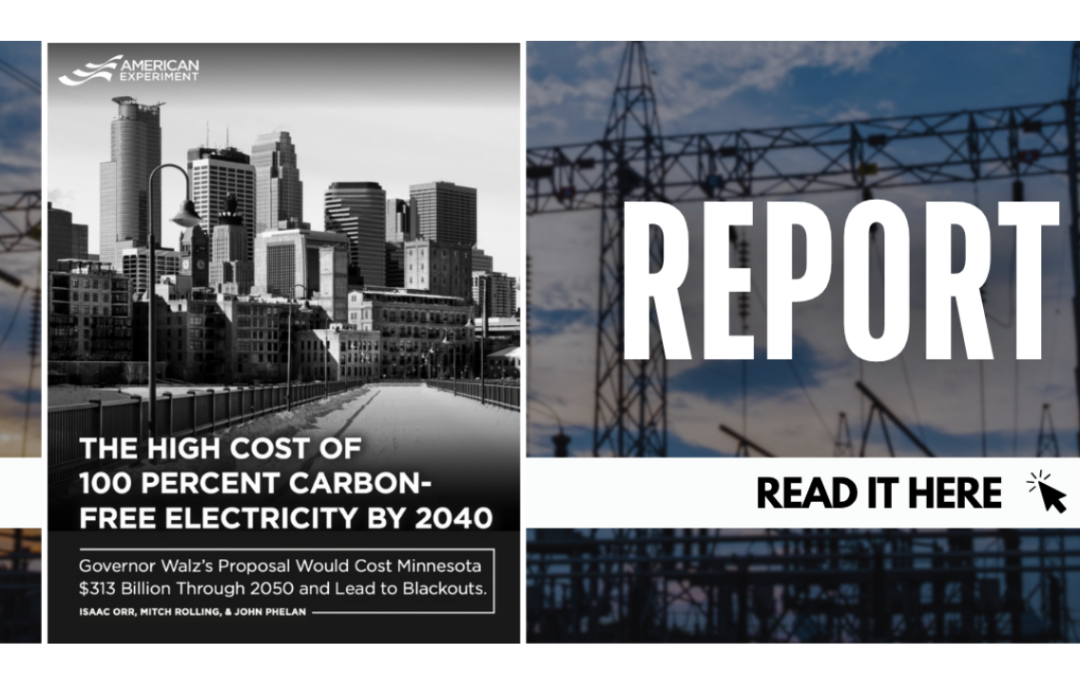
John co-authored a research paper in September 2022 that detailed the projected high costs of “essentially a wind, solar, and battery storage mandate” under the 2023 Clean Electricity Standard. Given this push first started in 2001-2007, the results since then are historical facts.
Rankings
Minnesota’s rankings, in terms of average electricity rates, are presented below in Chart 1, for residential, commercial, industrial and total end users. There are three distinct periods of 1970-1990, 1991-2002 and 2003-2026. Highlights and lowlights follow next:
- Total: 1970-1990 improved 27 places from #36 to #9; 1991-2002 deteriorated 3 places from #11 to #14; and 2003-2026 plummeted 17 places from #13 to #30.
- Residential: 1970-1990 improved 17 places from #32 to #15; 1991-2002 deteriorated 4 places from #17 to #21; and 2003-2026 declined 9 places from #19 to #28.
- Commercial: 1970-1990 improved 32 places from #44 to #12; 1991-2002 increased 1 place from #13 to #12; and 2003-2026 declined 12 places from #13 to #25.
- Industrial: 1970-1990 improved 25 places from #40 to #15; 1991-2002 increased 3 places from #19 to #16; and 2003-2026 plummeted 16 places from #17 to #33.
- Note: worst ranks in the 21st century were #37 for total end users in 2021, #36 for residential in 2020, #36 for commercial in 2021, and #39 for industrial in 2021-2022.
Chart 1

Rates
Minnesota’s electricity rates, in terms of cents per kilo-Watt-hour (¢/kWh), are presented below in Chart 2, for residential, commercial, industrial and total end users. There are three distinct periods of 1970-1982, 1983-2002 and 2003-2026. Highlights and lowlights follow next:
- Total: 1970-1982 inflated 163% from 2.06 to 5.42 (¢/kWh); 1983-2002 increased 5% from 5.55 to 5.80 (¢/kWh); and 2003-2026 skyrocketed 117% from 6.01 to 13.03.
- Residential: 1970-1982 inflated 152% from 2.49 to 6.27 (¢/kWh); 1983-2002 increased 13% from 6.62 to 7.49 (¢/kWh); and 2003-2026 skyrocketed 112% from 7.65 to 16.25 (¢/kWh).
- Commercial: 1970-1982 inflated 106% from 2.63 to 5.43 (¢/kWh); 1983-2002 increased 1% from 5.80 to 5.88 (¢/kWh); and 2003-2026 skyrocketed 104% from 6.12 to 12.47 (¢/kWh).
- Industrial: 1970-1982 inflated 232% from 1.40 to 4.65 (¢/kWh); 1983-2002 decreased -11% from 4.55 to 4.07 (¢/kWh); and 2003-2026 skyrocketed 124% from 4.36 to 9.75 (¢/kWh).
- Note: total, residential and commercial rates were largely flat in 1983-2002, whilst industrial deflated.
Chart 2

Reforms
This state is sunk, unless there are electricity reforms that deliver affordability, growth and jobs for all Minnesotans; and not just for the politicians, lobbyists and elites. This means: less renewables, regulations and subsidies; and more reliables, competition and freedom.
Thus, in 2027 the MN governor, legislature and PUC need to:
- lift the moratorium on nuclear power;
- impose a moratorium on banning natural gas;
- impose a moratorium on retiring coal;
- impose a moratorium on expanding renewables.
Therefore, in 2028 and beyond the MN governor, legislature and PUC need to:
- make the four 2027 solutions above permanent;
- make PUC commissioners elected positions, with term limits if and when rates are above inflation (e.g. CPI+X);
- move from disincentive regulation (i.e. rate of return) to incentive regulation (e.g. CPI-X);
- open up the unnatural franchise monopoly markets to genuine competition.

Source: American Experiment, The High Cost of 100 Percent Carbon-Free Electricity by 2040