
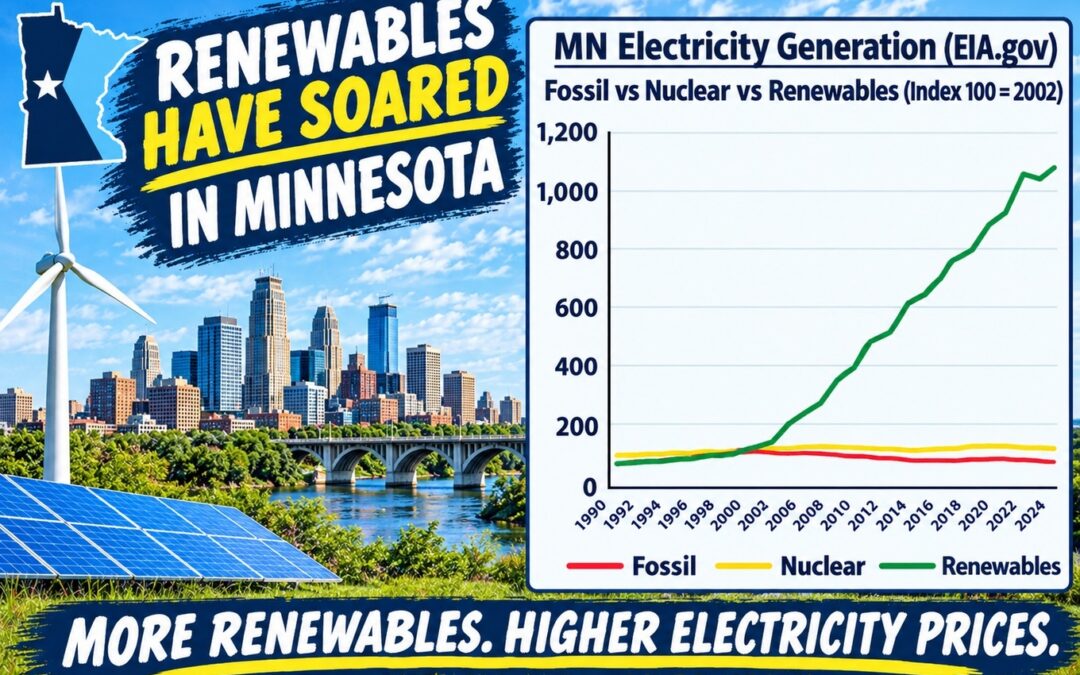
My previous two articles on September 10th and 8th showed that wind and solar renewables dramatically raised electricity prices in Minnesota and elsewhere around the country from 2002 onwards. This is backed up by the meteoric rise in renewable generation in Minnesota (MN) over the past two decades, even compared to the rest of the Midwest (MW) and US.
As the old saying goes, “a picture is worth a thousand words.” Thus, instead of me writing my usual thousand or more words, I will, to use another adage, “let the pictures do the talking”, that being the ten charts to follow below. The data behind these charts were all sourced from the Energy Information Administration (EIA).
Minnesota Renewables
Renewables include hydro, solar and wind. Renewable generation in MN starts to take off from 2005, driven by wind, then solar starts to grow from 2017, with hydro staying relatively flat. Fossil peaks in 2003, with nuclear and renewables both doing so in 2022. Note that MWh is megawatt-hours, and TWh is terawatt-hours or a million MWh. Highlights from the following three charts below are for 2002 to 2024:
- Chart 1: renewables increased by 946% from 1.7 to 17.9 TWh, nuclear and fossil decreased by 13% (13.7 to 11.8 TWh) and 23% (35.5 to 27.3 TWh) respectively.
- Chart 2: renewables increased from 100 to 1,046 index points, nuclear and fossil decreased from 100 each to 87 and 77 respectively.
- Chart 3: the ratio of total generation by renewables increased from 3% to 31%, nuclear decreased from 26% to 20%, and fossil decreased from 67% to 47%.
Chart 1

Chart 2

Chart 3

Relative Renewables
MN’s renewables ratio goes above the MW from 1998 and the US from 2008 onwards respectively. MN’s nuclear ratio stays above the US from 1990 to 2024, but dips below the MW in 2013, 2015, 2016, 2023 and 2024. MN’s fossil ratio is always below the MW from 1990 to 2024, and then stays below the US from 2005 to 2024. Highlights from the following three charts below are for 2002 to 2024:
- Chart 4: the renewables generation ratio for MN increased from 3% to 31%, for MW from 2% to 21%, and US from 7% to 21%.
- Chart 5: the nuclear generation ratio for MN decreased from 26% to 20%, for MW from 21% to 20%, and US from 20% to 18%.
- Chart 6: the fossil generation ratio for MN decreased from 67% to 47%, for MW from 75% to 58%, and US from 68% to 59%.
Chart 4

Chart 5

Chart 6

Unreliable Renewables
Unreliables are wind and solar renewables only, without hydro. Reliables are fossil plus nuclear plus hydro. Clean, by the way, is all three renewables plus nuclear. Highlights from the following three charts below are for 2002 to 2024:
- Chart 7: MN unreliables increased from 100 to 1,884 index points, reliables and the rest decreased from 100 to 80 each.
- Chart 8: MN’s unreliables generation ratio increased from 2% to 29%, reliables ratio decreased from 95% to 68%, and the rest ratio decreased from 4% to 3%.
- Chart 9: the unreliables ratio increased for MN from 2% to 29%, for MW from 0.1% to 19%, and US from 0.3% to 16%.
- Chart 10: the reliables ratio decreased for MN from 95% to 68%, for MW from 99% to 80%, and US from 95% to 82%.
Chart 7

Chart 8

Chart 9

Chart 10

Renewables Conclusion
In conclusion, Minnesota’s wind and solar renewables, or unreliables, “grew like Topsy” by a staggering 1,784% from 2002 to 2024, going from 2% of total generation to 29%. In contrast, the Midwest and US went from under 1% in 2002 to 19% and 16% respectively by 2024.
Clean nuclear is of particular note as well. In Minnesota, nuclear decreased 13% from 2002 to 2024, whilst it remained largely the same over that period for the Midwest (i.e. 0.2% decline) and US (i.e. 0.2% growth). The nuclear ratio for MN also decreased from 26% to 20%.
As I wrote on September 2nd, the Great Plains Institute (GPI) are currently seeking public input into a MN Nuclear Energy Study. GPI has a website for the study as well as for the Request for Information (RFI). Responses must be submitted by 11:59 pm on September 14th.
