
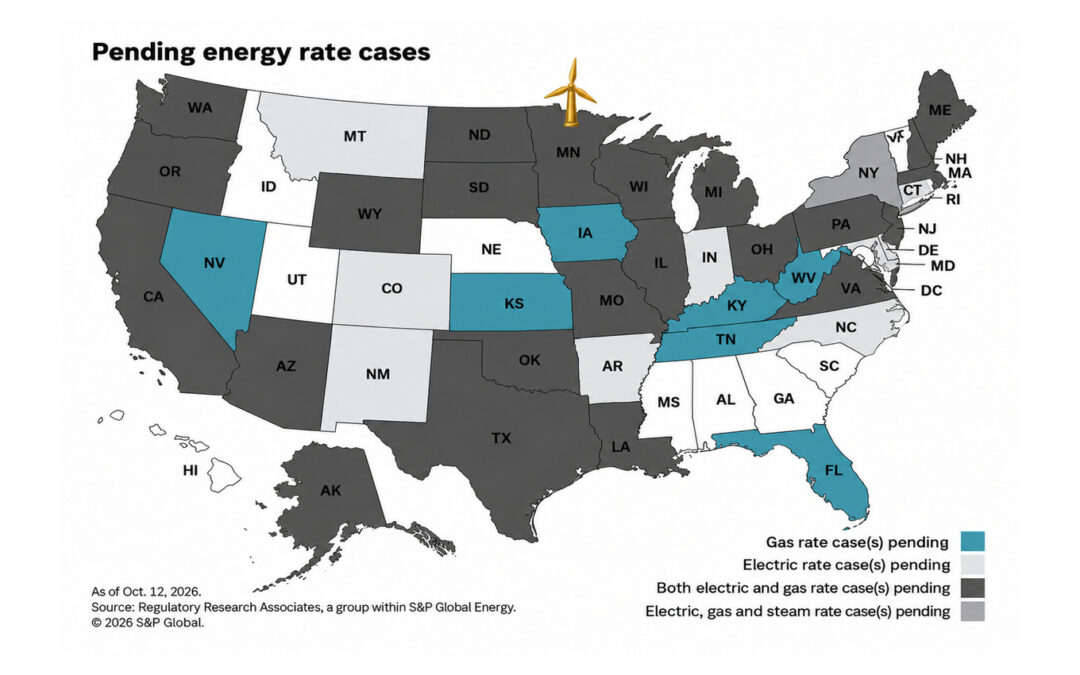
S&P Global Energy published new research on October 29th confirming my thesis that: electricity affordability concerns are real; and that renewables energy spending is unreal. Highlights from this report, and related ones, follow next, along with comments and charts.
Note that Minnesota AG Keith Ellison is currently challenging Xcel’s electricity return on equity (ROE) that was approved last summer by the MN Public Utilities Commission (PUC). This misses the mark, as it is not ROE that is the problem, but the capital base it applies to.
Also note that two common formulas for ROE are as follows:
- ROE (basic formula) = Net income after tax / Average shareholder’s equity
- ROE (DuPont formula) = (Net profit / Revenue) * (Revenue / Total assets) * (Total assets / Shareholder’s equity) = Net profit margin * Asset Turnover * Financial leverage
October 29, 2026
The research by S&P Global Energy that was published on October 29, 2026 is entitled “Rate case activity remains elevated, with affordability shaping regulation” by Lisa Fontanella.
Rate case activity is expected to remain robust through 2027 as utilities continue to recover rising costs and fund significant capital investment programs. At the same time, affordability concerns are likely to play an increasingly prominent role in shaping regulatory outcomes and ratemaking policies.
The PUC is currently undertaking a dedicated investigation into electricity and natural gas affordability along with two natural gas “innovation” related dockets. My public comments on the former can be found here, and on the latter here. I have also made public comments here, to the contemporaneous nuclear power study by the MN Department of Commerce.
Capital spending continues to drive rate case activity. Utilities are investing heavily in grid modernization, system resiliency, renewable energy integration, cybersecurity, advanced metering, energy storage and infrastructure needed to support growing electricity demand.
Capital spending (capex) is driven by “renewable energy integration” which in turn is driving “grid modernization, system resiliency, … advanced metering, [and] energy storage,” which has been documented many times by me, most recently here in terms of “gold plating.” However, despite “growing electricity demand” from data centers (on top of that from residential, commercial and industrial customers), total electricity use in MN has been sinking since 2008 due to electricity price inflation. (see Chart 1 below)
Chart 1

Chart 2

Rising customer bills have prompted regulators and policy-makers in several jurisdictions to re-evaluate traditional rate-making approaches and place greater emphasis on customer impacts, transparency and performance-based outcomes. Interest also continues to grow in alternative regulatory frameworks, including multi-year rate plans, formula-based ratemaking and performance-based mechanisms. (see Chart 2 above)
I recently wrote about “traditional rate-making approaches … multi-year rate plans, formula-based ratemaking and performance-based mechanisms” here, and in my submission to the PUC energy affordability inquiry here, not to mention my competition policy piece here.
The returns on equity [ROE] requested in the pending cases range from 9.50% to 13.20%, averaging 10.48% in vertically integrated electric rate cases, 10.27% in electric distribution rate cases and 10.52% in gas base rate cases.
The MN PUC recently approved a 9.6% ROE for Xcel, which is not excessive compared to “averaging 10.48% in vertically integrated electric rate cases” nor to NYU data on ROE that includes 9.7% oil, 10.3% water, 11.1% cable TV, 12.4% power, 17.2% market, nor -7.4% renewables. As per Chart 3 below, Aii found in July 2026 that linear authorized ROE declined over time from slightly above 11% in 2000 to a bit under 9.5% in 2026.
Chart 3

September 3, 2026
S&P’s Lisa Fontanella published research regarding regulated energy ROEs on September 3, 2026 under the title of “Average gas ROE edges down as electric holds firm in H1 2026.”
For the electric general rate cases, the median ROE authorized was 9.75% in the first half of 2026 versus 9.70% in full-year 2025. There were 25 electric ROE authorizations in the first half of 2026 versus 86 in full-year 2025. (see Chart 4 below)
For gas general rate cases, the median ROE authorized was 9.75% in the first half of 2026, unchanged from 9.75% in full-year 2025. There were 13 gas ROE authorizations in the first half of 2026 versus 68 in full-year 2025. (see Chart 4 below)
Chart 4

The Xcel electricity ROE approved by the PUC, and being challenged by AG Ellison, is 9.6%. The previously approved ROE was 9.25%. The PUC rejected Xcel’s proposed 10.3% ROE. The Administrative Law Judge [ALJ] had recommended an ROE of 9.8%.
January 23, 2026
On January 23, 2026 Dan Lowrey of S&P wrote about “Record amount of utility rate requests in 2025 amid affordability concerns.”
Rate requests in 2025 were again dominated by electric utilities, which requested $18.23 billion in aggregate rate increases, while gas utilities requested $3.83 billion. The electric rate filings reflect the utilities’ significant capital expenditure plans for upgrading transmission and distribution (T&D) systems and installing new renewable generation and technologies to accommodate the clean energy transition, as well as fossil and nuclear generation, to support large loads. The gas filings continue to reflect investment to replace aging infrastructure. Inflation and the rising cost of capital continue to be highlighted as factors in recent case filings. (see Chart 5 below)
Chart 5

The rise in electricity rate increase requests in the 21st century is very consistent with the rise in renewable capex by public utilities. The rise in natural gas (NG) rate increase requests in the 2020s is consistent with both: the rise in NG capex for electricity generation and industrial uses; as well as the efforts in many states to ban NG use for residential and commercial customers but not for electricity generation and industrial ones.
As we enter 2026, affordability remains a key issue shaping the US power and utility sector, moving from a background concern to a binding constraint on what utilities can earn and build. This shift is driven by mounting pressure at state and federal levels, with energy prices having risen much faster than inflation and customer dissatisfaction at historic highs.
The PUC frequently claims the opposite in public meetings. They are wrong, as BLS CPI data clearly shows in Chart 6 below for the Twin Cities (MSP) that from 2001 to 2024:
- MSP electricity CPI of 127% exceeded general inflation of 70% by 58%.
- Midwest (MW) electricity CPI of 91% exceeded general inflation of 68% by 23%.
- US electricity CPI of 103% exceeded general inflation of 77% by 25%.
Chart 6

Cognizant of rising affordability concerns, utilities have been taking steps to highlight for commissions their efforts to reduce costs and improve efficiency even as they ask for higher rates.
Consistent with Public Choice Economics, it is more-than-likely that Xcel, being “cognizant of rising affordability concerns,” pushed the PUC for the current investigation into electricity and NG affordability, in order to “highlight for [the public] their efforts [and those of the PUC as well] to reduce costs and improve efficiency even as they ask for higher rates.”
The surge in requested rate increases comes amid rising capex by the energy utility sector. Spending is driven by pent-up demand to replace and modernize aging infrastructure, as well as renewable portfolio standards [RPS] of multiple states that call for large expansions in low-carbon energy generation capacity.
Minnesota has embraced RPS more so than almost anywhere else in America and the Midwest. Chart 7 below shows renewables generation ratio growth for MN, MW and US:
- The renewables generation ratio for MN increased from 3% to 31%, for MW from 2% to 21%, and US from 7% to 21%.
- The nuclear generation ratio for MN decreased from 26% to 20%, for MW from 21% to 20%, and US from 20% to 18%.
- The fossil generation ratio for MN decreased from 67% to 47%, for MW from 75% to 58%, and US from 68% to 59%.
Chart 7

Data centers — which underpin AI, digital services and cloud infrastructure — are rapidly becoming a significant new driver of power demand in various regions. This trend is expected to result in substantial capital investments for years to come, including massive investment in natural gas generation, new nuclear capacity and reviving retired coal plants or those planned for retirement.
A study from June 18, 2026 by the Electric Power Research Institute (EPRI) found that: “While ratepayers fear new load [from data centers] will raise prices, the historical record is consistent with the opposite. We estimate for every 10% increase in data center capacity average residential retail prices fell by approximately 0.4% on average. The estimate can be interpreted thus: a doubling of data center capacity causes residential retail prices to fall by 3.5% for a fixed level of residential demand.”
July 19, 2019
Lori Aniti was the principal contributor to an article posted at the Energy Information Administration (EIA) website on July 19, 2019 regarding “The number of electric utility rate cases increased in 2018.”
Electric utility rate case filings have not been this active since the early 1980s. The oil crises in the 1970s increased the cost of oil-fired generation, leading to investments in coal and nuclear plants. The accident at Three Mile Island in 1979 increased safety-related costs at nuclear plants. The Public Utility Regulatory Policies Act of 1978 (PURPA) encouraged utilities to buy generation from small renewable facilities. Together, these events contributed to electricity rates increasing at an average annual rate of 12% in the decade following the 1973 oil embargo.
It is noteworthy that renewables first played a role in electricity inflation, although perhaps a minor one, unlike the major one in the 21st century, from the late 1970s and early 1980s.
In 2018, 89 utilities—or nearly half of all major U.S. electric utilities—tried to change electricity rates by filing rate cases with state regulatory commissions; this number was the largest number since 1983. Of the 89, 10 proposed to decrease rates, 1 negotiated a rate freeze until 2020, and the other 78 utilities proposed rate increases. In 2018, increases in spending for electricity transmission and delivery, rather than for electric generation, drove most of the approved rate increases. Delivery expenses included investments to modernize and strengthen the electric power grid [plus] connect to wind and solar installations. Increases in electric generation costs also led to rate increases in some areas. Reasons…included…extra wind generation expenditures. (see Chart 8 below)
Chart 8

The 21st century rise in electricity rate case filings mirrors that of large-scale wind and solar renewables capex as well as the supporting transmission, storage and back-up capex.
Regulators have traditionally approved lower rate increases than what the utilities have requested. In 2018, the aggregated value of utility-rate increase requests was $6.8 billion, and regulators approved a total increase of $2.8 billion. (see Chart 9 below)
Chart 9

Public utilities, like Xcel, saw a unique business opportunity to “gold plate” their capital base with massive and almost never-ending capex on wind and solar unreliables, with far less push-back from regulators, like the MN PUC, compared to if they requested massive but more finite capex on coal, NG and nuclear reliables.
Conclusion
Please have your say next week Tuesday the 3rd to the DFL and GOP, as well as next Monday the 2nd to the PUC, because, as I have demonstrated many times here since June 10th:
- electricity affordability is a big problem in Minnesota (see Chart 10 below);
- has been since REO 2001, RES 2007 and CES 2023 (see Chart 11 below); and
- this is driven by too much wind and solar renewables and too little nuclear, natural gas and coal reliables (see Chart 12 below).
Chart 10

Chart 11

Chart 12

Cover Image Source: S&P Global Energy
