
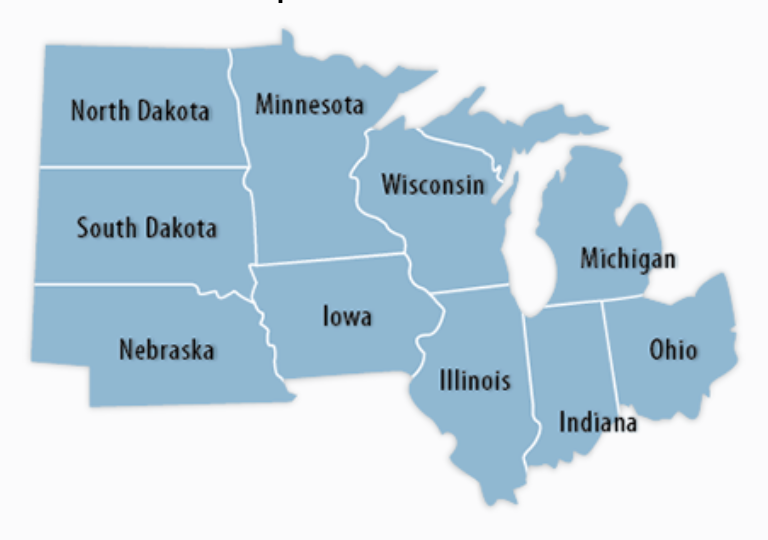
Image Source: Bureau of Labor Statistics (BLS) Midwest Information Office
As the artist known as Meatloaf once sang: “Now don’t be sad. ‘Cause two out of three ain’t bad.” Given that, Minnesotans should be singing: “Now do be sad. ‘Cause one out of four is bad.” The latter refers to MN electricity affordability compared to the four neighboring states.
Note that, in the electricity affordability charts to follow, both rising rates and rising rankings are bad. The former is rates inflation. The latter is because #51 is at the top, and #1 at the bottom. There are 51 ranks, rather than just 50 states, given Washington DC is also included.
Iowa
Charts 1 and 2 below show that MN’s electricity affordability rates and rank rose above IA’s from 2007 onwards. Highlights for 2001 to 2026 include:
- MN’s rank worsened 16 places, from #14 to #30.
- IA’s rank improved 13 places, from #20 to #7.
- MN rates inflated 118%, with volatility of 24%, thus misery of 142%.
- IA rates inflated 64%, with volatility of 15%, thus misery of 79%.
Chart 1

Chart 2

North Dakota
Charts 3 and 4 below show that MN’s electricity affordability rates and rank rose above ND’s from 1998 onwards. Highlights for 2001 to 2026 include:
- MN’s rank worsened 16 places, from #14 to #30.
- ND’s rank improved 9 places, from #10 to #1.
- MN rates inflated 118%, with volatility of 24%, thus misery of 142%.
- ND rates inflated 59%, with volatility of 17%, thus misery of 76%.
Chart 3

Chart 4

South Dakota
Charts 5 and 6 below show that MN’s electricity affordability rates and rank rose above SD’s from 2005 onwards. Highlights for 2001 to 2026 include:
- MN’s rank worsened 16 places, from #14 to #30.
- SD’s rank improved 2 places, from #24 to #22.
- MN rates inflated 118%, with volatility of 24%, thus misery of 142%.
- SD rates inflated 93%, with volatility of 21%, thus misery of 114%.
Chart 5

Chart 6

Wisconsin
Charts 7 and 8 below show that WI’s electricity affordability rates and rank rose above MN’s from 2001 onwards, except for 2021 and 2022. Highlights for 2001 to 2026 include:
- MN’s rank worsened 16 places, from #14 to #30.
- WI’s rank deteriorated 15 places, from #18 to #33.
- MN rates inflated 118%, with volatility of 24%, thus misery of 142%.
- WI rates inflated 119%, with volatility of 21%, thus misery of 140%.
Chart 7

Chart 8

Conclusion
In conclusion, #30 Minnesota compares poorly to three out of the four neighboring states, in terms of electricity affordability ranks and rates, so far in the 21st century. Those three states are Iowa, North Dakota and South Dakota, which are ranked at #7, #1 and #22 in 2026.
Even the one that MN compares favorably with, of Wisconsin, is no slam dunk. MN sunk 16 places from #14 in 2001 to #30 in 2026, compared to WI’s 15 places from #18 to #33. MN’s electricity rate inflation over that period was 118% to WI’s 119%, whilst volatility was 24% to 21%.
As it turns out, there is a “Two Out Of Three Ain’t Bad” connection after all. Minnesota beats Wisconsin in terms of the 2026 ranking of #30 to #33, as well as 2001-2026 inflation of 118% to 119%. But MN loses to WI on the volatility front of 24% to 21%, thus misery too of 142% to 140%.

Image Source: Amazon