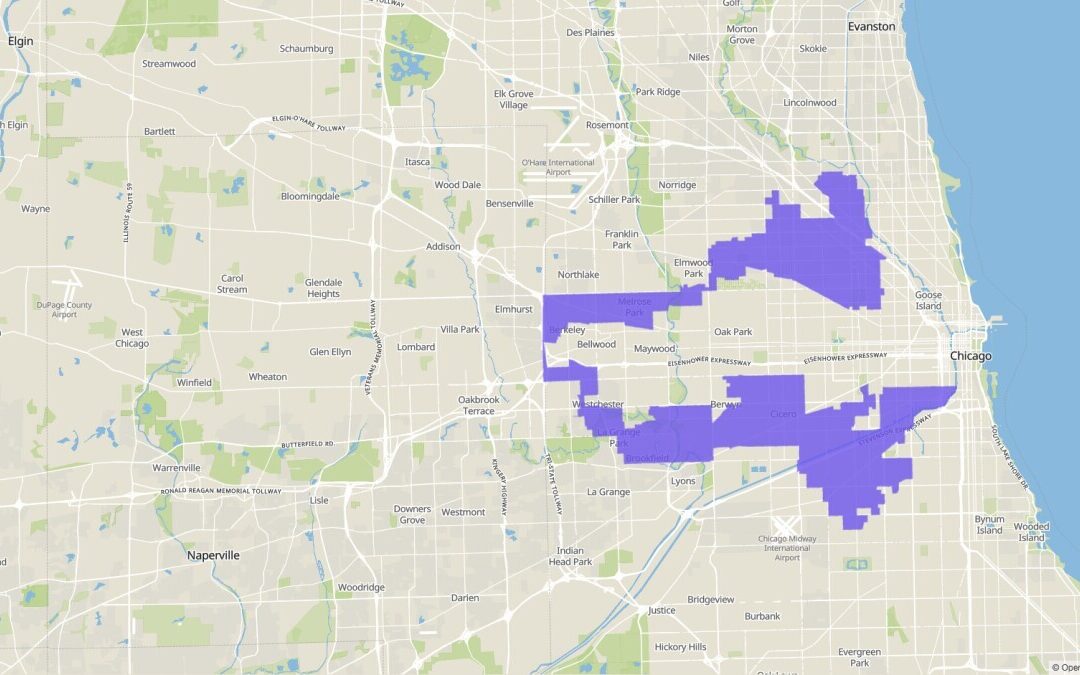
Gerrymandering — the practice where politicians choose their voters rather than the other way around — is much in the news at present. Faced with moves to redistrict, Democrats in Texas have fled the state for Illinois in an attempt to deny the legislature a quorum and prevent it doing business, a story familiar to Minnesotans.
What is the truth about gerrymandering? At the federal level, it doesn’t make much sense to talk about it in the context of Presidential or Senate races as those are held statewide, unless you think the states themselves represent a gerrymander. So, we will look at the House of Representatives, where the country is divided into 435 districts depending on the state’s population, with California allotted 52 seats and North Dakota, among others, just one.
We want to see how closely the partisan composition of the state’s House delegation matches the partisan vote split with those that deviate most being, we assume, the most “gerrymandered.” We will base this on the results for the 2024 elections for the House of Representatives.
There are six steps in this process. First, we take the Democratic party’s vote share in each state. Second, we take the share of each state’s seats won by the Democratic party. Third, we subtract the latter from the former to get the percentage point difference between the share of votes cast for Democrats and the share of seats won by them. Fourth, we convert the negative values — where the deviation is in favor of the Republicans — to positive values and divide all the percentage point scores by ten. This gives us our inaugural American Experiment Index of Gerrymandering, with scores ranging from 0.0 for the least gerrymandered to 4.9 for the most. Sixth, we remove all thirteen states with either one or two seats in the House of Representatives — six of which deviate towards the Democrats and seven towards Republicans — because, in the first instance, these delegations cannot be divided, and, in the second, they cannot be divided whilst respecting the majority principle.
The results are shown in Table 1. We see that, of the 37 states remaining, thirteen deviate towards the Democrats (highlighted in blue) and 24 towards the Republicans (in red). But we also see that the average index of deviations towards Democrats is 2.5 compared to just 1.6 for those towards Republicans. In short, when Democratic states gerrymander, they do it more aggressively than Republican ones. Indeed, if we apply the actual vote shares won by Democrats in each state in 2024 to the number of seats each state has, the Democrats would gain 31 House seats in states like Iowa and Nebraska but lose 37 in states like California and New York for a net loss of six seats in the House of Representatives.
Table 1: American Experiment Gerrymander Index, 2024

It is odd that Texas Democrats have fled a state with a score on our index of 0.6 for one with a score of 3.0, heading from a less gerrymandered state to a more gerrymandered one to protest gerrymandering. The good news for us is that Minnesota scores 0.0, the best in the United States, with the 50-50 composition of our state’s House delegation reflecting very closely the vote shares in the election. Perhaps Governor Walz will tweet in celebration?
The post On gerrymandering, three cheers for Minnesota! appeared first on American Experiment.

